
Bitcoin (BTC) Price Sighting Downside Thrust Before Higher?
Story by: Aayush Jindal
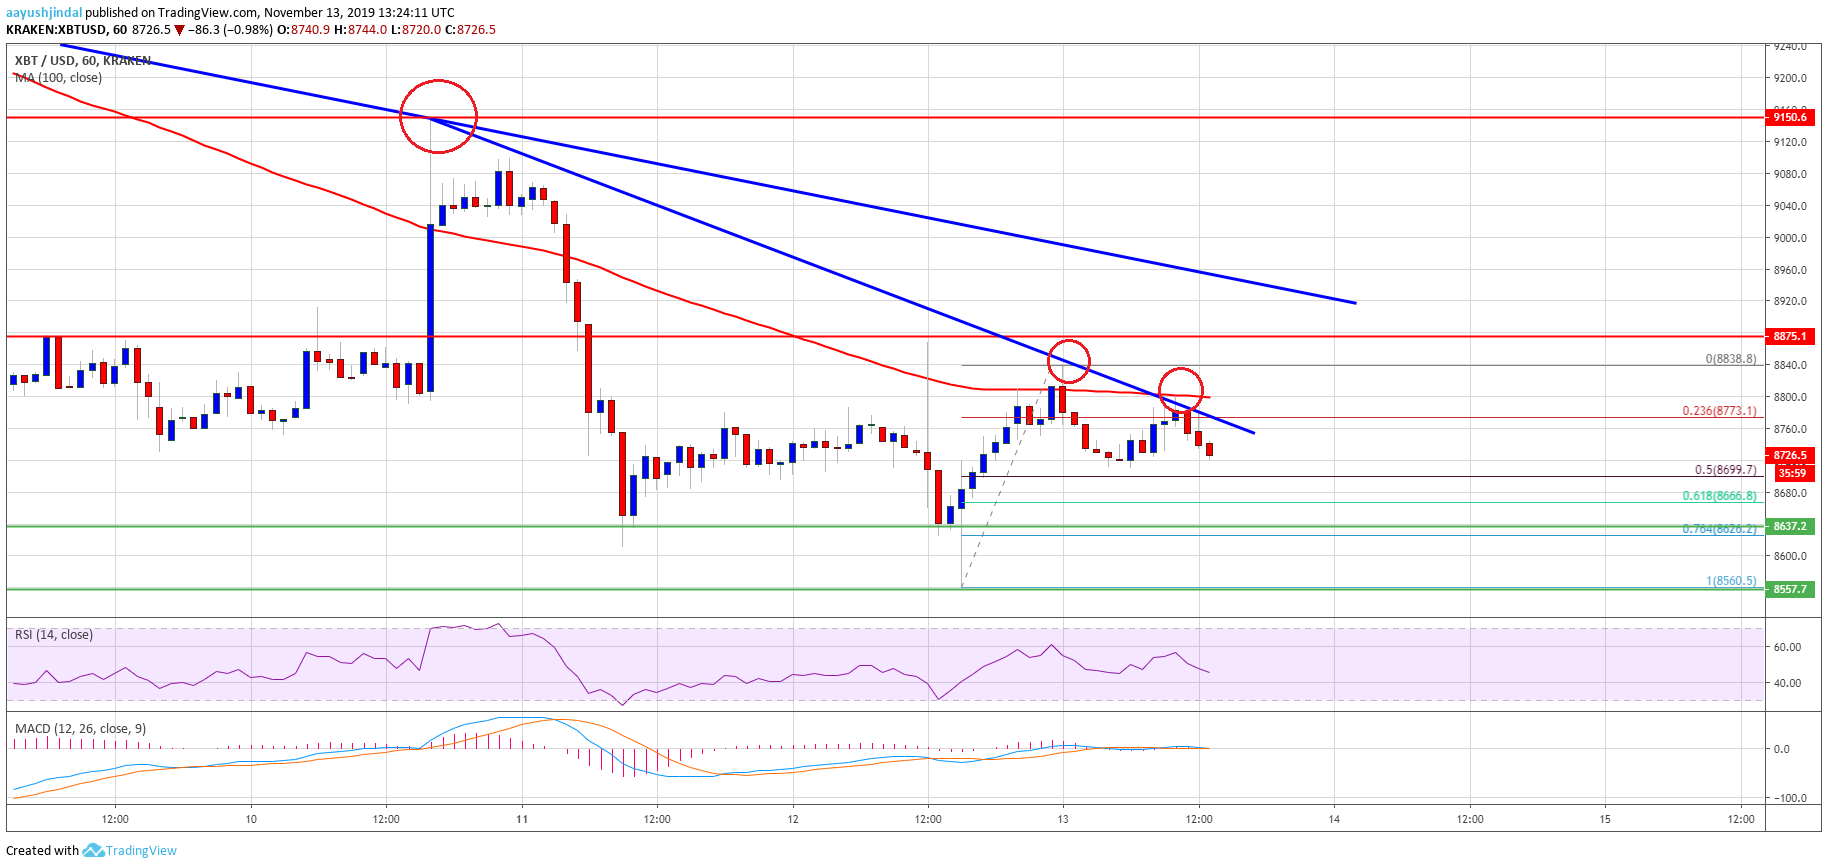
- Bitcoin price is struggling to recover above $8,800 and $8,840 against the US Dollar.
- The price is slowly moving lower and it is likely to decline sharply below $8,600.
- Morning’s bearish trend line is active with resistance near $8,775 on the hourly chart of the BTC/USD pair (data feed from Kraken).
- It seems like there could be a nasty decline below $8,600 before the price starts a decent recovery.
Bitcoin price is still trading in a downtrend below $8,800 against the US Dollar. BTC needs to settle above the $8,920 and the 100 hourly SMA to start a recovery.
Bitcoin Price Analysis
In morning, we saw an upside correction in bitcoin from the $8,560 swing low against the US Dollar. However, BTC faced a strong resistance near the $8,800 level and the 100 hourly simple moving average.
There was another decline below the $8,750 level. Moreover, the price broke the 23.6% Fib retracement level of the upward move from the $8,560 low to $8,839 high. The price even broke the $8,720 level, but it stayed above the $8,700 level.
More importantly, morning’s bearish trend line is active with resistance near $8,775 on the hourly chart of the BTC/USD pair. The pair is once again declining and is trading below the $8,750 level.
If the price fails to stay above the $8,700 level, it could continue to move down. The next support is near the $8,640 level. It represents the 61.8% Fib retracement level of the upward move from the $8,560 low to $8,839 high.
It seems like bitcoin is setting up for a downward spike below the $8,600 support area. Additionally, it could even spike below the $8,500 support area before the bulls take a stand.
Conversely, the price is likely to struggle near many resistances, starting with $8,800. The main resistance is near $8,900 and another important bearish trend line on the same chart. For that reason, a close above $8,920 is needed for a decent recovery.
Technical indicators:
Hourly MACD – The MACD is slowly moving in the bearish zone.
Hourly RSI (Relative Strength Index) – The RSI for BTC/USD is sliding and it is well below the 50 level.
Major Resistance Levels – $8,800, $8,850 and $8,920.
Original story: https://www.newsbtc.com/2019/11/13/bitcoin-btc-price-sighting-downside-thrust-before-higher/