
Bitcoin’s Stock-To-Flow Model Is Still On Track
What is Stock-to-Flow?
When a bitcoin miner satisfies a proof of work requirement with computational power and electricity, he or she is rewarded with a newly created bitcoin. The number of coins rewarded for a miner meeting this requirement began with fifty. It is halved every 210,000 blocks, which occurs roughly every four years. This will continue until the stock of existing bitcoins reaches 21 million, at which point, no more coins can be mined.
The stock-to-flow ratio is the ratio of current stock of bitcoin over incoming coins for a specific period. That means the ratio doubles roughly every four years. If demand for coins remain the same, and incoming supply is halved, the price should naturally appreciate.
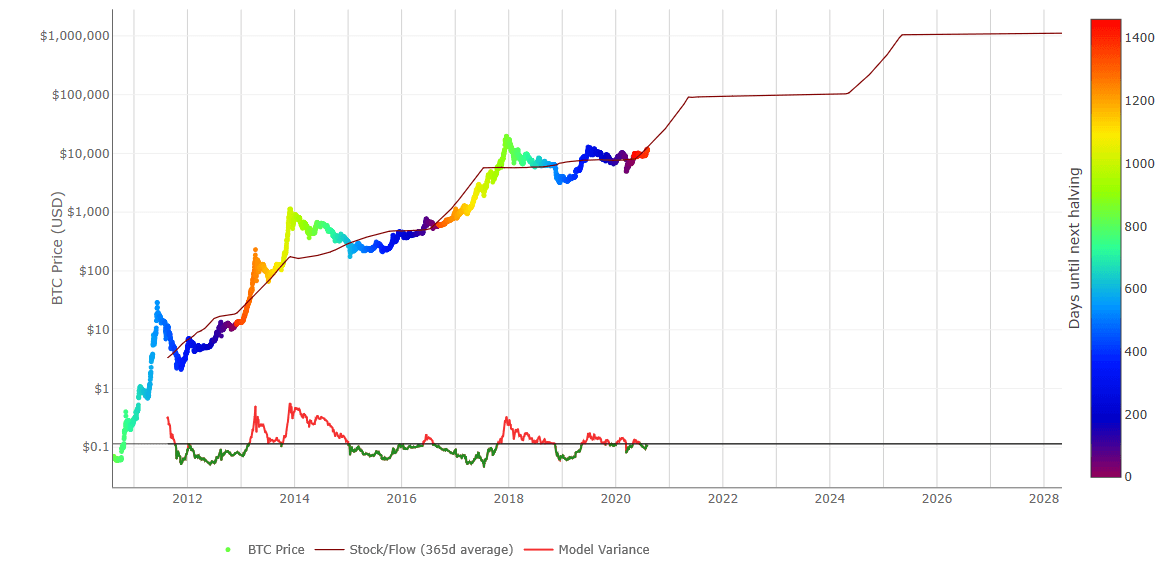
(Source: LookIntoBitcoin.com)
The SF model has a 95% correlation coefficient with the price per bitcoin. The premise is that the SF ratio measures scarcity and is the primary driver behind bitcoin’s price. The price of scarce assets such as gold and housing can also be modeled using SF. Now take into account fiat currency’s abundance versus bitcoin’s scarcity. If incoming supply is halved while demand continually increases as investors seek a scarce, safe haven asset to protect their purchasing power, the price of bitcoin can easily go above $250,000.
What is the model saying?
The model is telling bitcoin investors that we are still on track. Bitcoin acted much like gold in response to the March crash from COVID-19. In a panic, even safe haven assets are sold off as investors seek liquidity to make margin requirements. However, bitcoin rebounded strongly and recently underwent a massive rally that put its price back in line with SF estimates. Bitcoin just survived its first market panic and was back to model predictions within months. That is a very bullish sign for investors.
Below are three charts demonstrating how the current price is matching SF model projections. The chart below is the current bull cycle (red line) overlaid on the last bull cycle (green line) since the bear market lows in December 2018. If this cycle follows the previous one exactly, the price per coin is estimated to reach $284,596. This concurs with Plan B’s estimate of $288,000 as the peak in the rally between now and 2024.
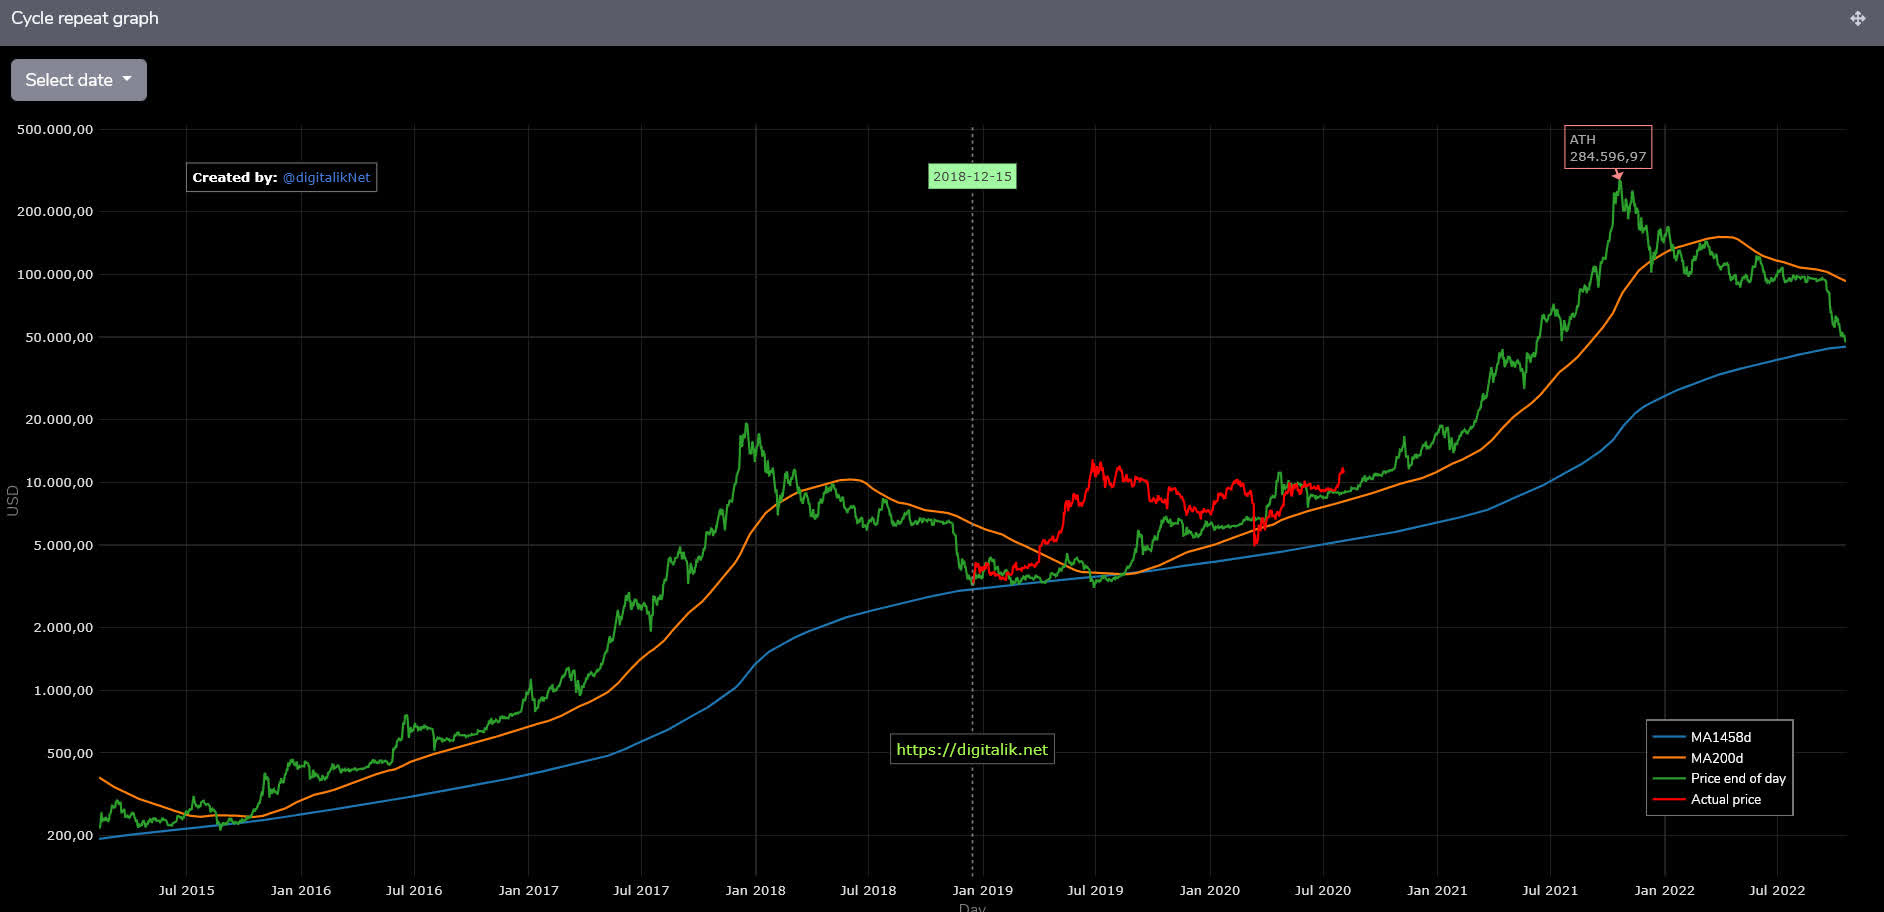
(Source: digitalikNet)
The second chart shows that though the price acted with a lag, the recent rally has put bitcoin within 4% of the SF model. The price should continue to appreciate from here and reach fair value of $100,000 per coin by October 2021.
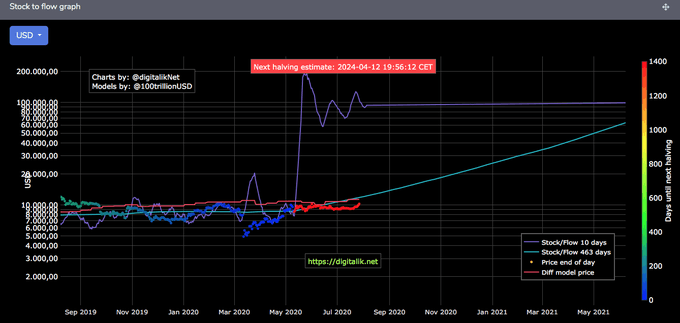
(Source: digitalikNet’s Twitter feed)
The next chart shows the current price since halving in green, with the previous two bull market cycles in orange and blue, respectively. As one would expect, the price rallied since the halving and is in line with Era 2 that saw the price breach the $20,000 handle. The differences in cycle longevity and ROI will be addressed in the next section.
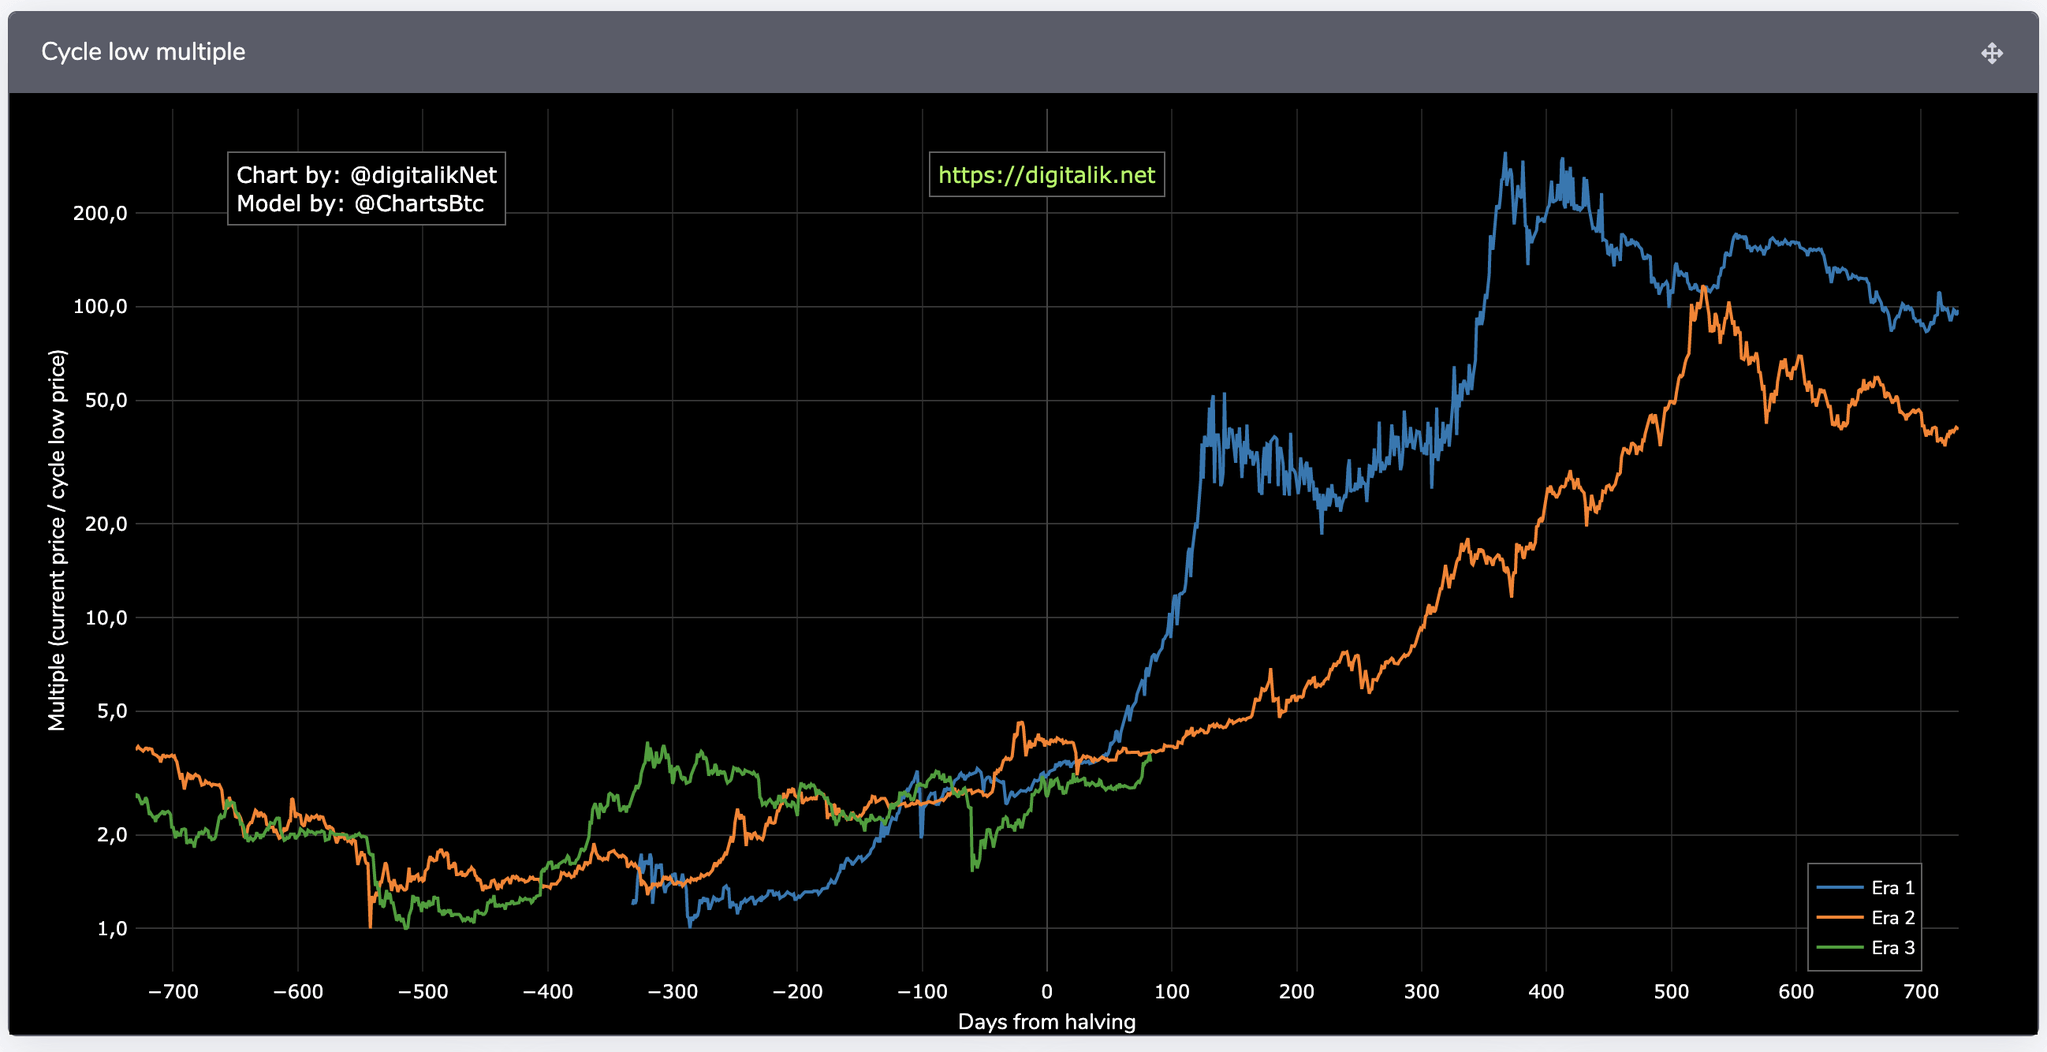
(Source: Ibid)
The case for prices falling short of projections
The long-term picture of the entire cryptocurrency market cap provides important insight on future price action. For one, the trend line flattens out over time, which indicates lower return on investment per each subsequent bull cycle. Secondly, each bull cycle has historically been longer and less volatile than the previous one. I expect the price to slowly grind higher for 12-24 months before experiencing a blowoff top.
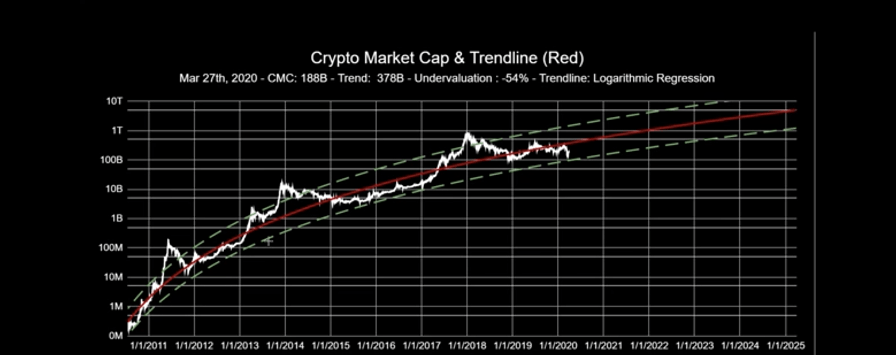
(Source: Into The Cryptoverse)
Even then, the blowoff top may be lackluster compared to previous ones. Both the market cap projection and Era 2 compared to Era 1 in the chart of the previous section signify less returns and more time to reach peak price. Despite this, bitcoin is still an undervalued currency with a meager $117 billion market cap compared to gold’s $9 trillion or treasury bonds’ $100 trillion.
The case for prices exceeding projections
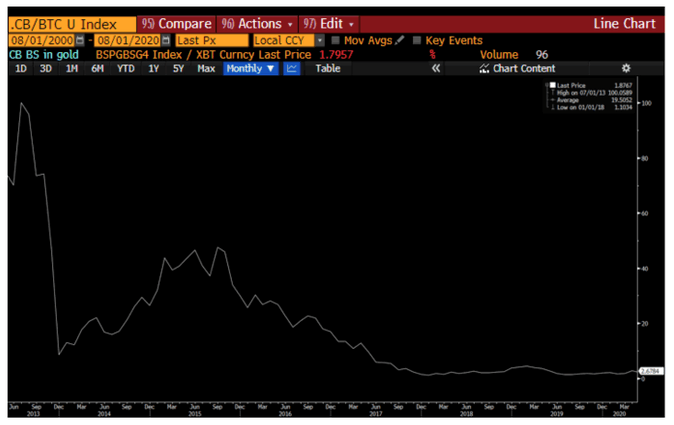
The two charts below show growth in G4 Central Bank balance sheets priced in gold and bitcoin. While many investors think of gold as the best asset to protect purchasing power in the face of Central Bank money creation, this chart indicates that bitcoin is the only asset to outperform growth in G4 balance sheets. Gold has lost 50% in terms of G4 money growth since 2008.
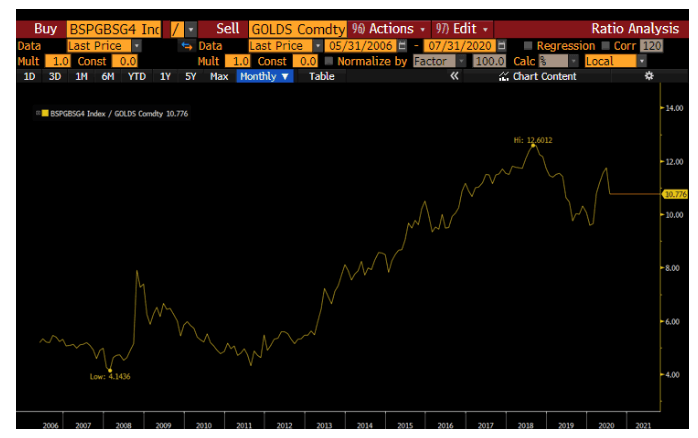
 (Source: RaoulGMI’s Twitter feed)
In the event of an inflationary crisis in the dollar, bitcoin’s infinite divisibility, liquidity, scarcity, and transactional nature will make it more valuable than physical gold, which does not contain those characteristics. Though I do not believe a currency crisis is imminent, this scenario would play well for bitcoin holders.
Conclusion
Bitcoin is the only asset to successfully offset the global Central Bank printing party. If you believe, as I do, that M2 growth will only accelerate with rates at zero and economic conditions still weak, bitcoin must play a part in your portfolio.
Additionally, the model that predicts a $100,000 price per coin by October 2021 has not been invalidated by the March market panic. While charts indicate we may experience a longer, less-pronounced rally, Bitcoin is a must-own asset class that makes sense from both quantitative and fundamental perspectives.
Via Seeking Alpha