
Top 3 Bitcoin, Ethereum and Ripple Price Predictions:
Story by: Tomas Salles
- Bitcoin remains in “Consolidation” mode and takes on the challenges ahead.
- Ethereum follows Bitcoin’s momentum but the price range is very small.
- Ripple is asleep and waiting for an event to take the edge off.
These are days for a pause for the three main actors of the crypto-board. These days could be extended until the end of the week if everything goes well.
One eye is open for another bullish escape for Bitcoin and the other eye is watching the minimum levels of the Altcoins that continue playing with very dangerous levels.
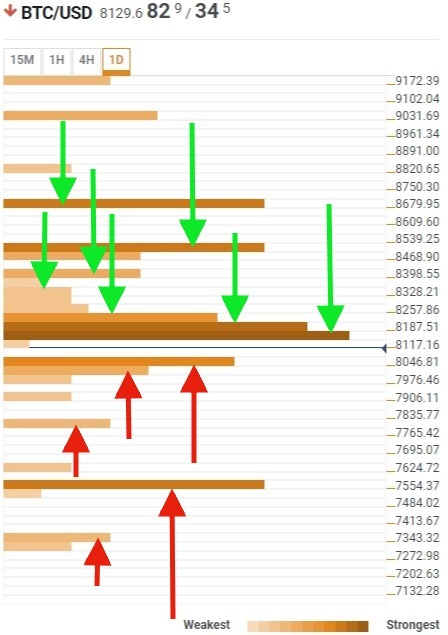
BTC/USD 1D
The BTC/USD is currently trading at $8,128, drawing the last downward leg of this consolidation process from the recent rally.
Above the current price, the first confluence level to beat is around the $8,200price level. It is the strongest resistance level in the range and beating it would ease the way for Bitcoin to rally. It is composed of, among others, the 4H and 1D minimum, the daily S1 Pivot Point level, the daily 23.6% and 38.2% Fibonacci levels, the 15 min SMA200 and the daily SMA50. Just above this confluence and almost as a continuation of it is the weekly 23,6% Fibonacci level and then the daily 61,8% Fibonacci. This list is now completed at around the $8,300 price level by the daily R1 and R2 Pivot Point levels and the daily 161.8% Fibonacci level.
Below the current price levels, Bitcoin only has two low-medium level confluence areas. First and foremost, the $8,040 price level support zone includes the 1-hour SMA200, the 4-hour SMA50, the daily S2 Pivot Point and the weekly 38.2% Fibonacci levels. This level is completed by the daily S3 level of Pivot Point.
The next confluence is at the $7,550 price level, the theoretical target of the consolidation process for the BTC/USD, which consists of the daily SMA100, the monthly R1 Pivot Point level, and the weekly S1 Pivot Point level. The 4 H SMA100 completes the confluence level.
Click to see the Full Confluence Indicator
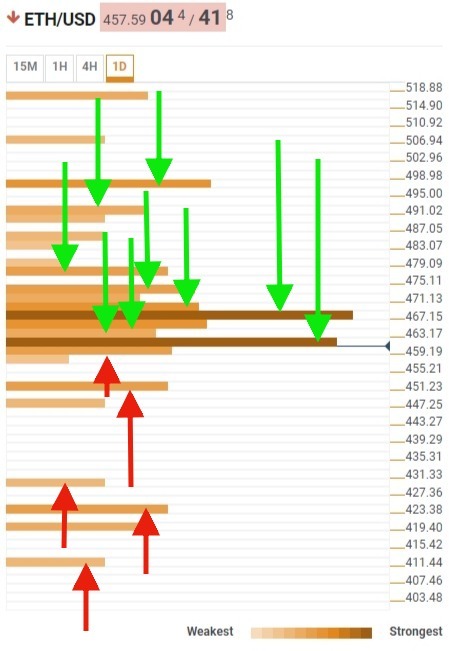
ETH 1D
The ETH/USD is currently trading at $459.4 and is in a critical situation as its bearish margin is very low.
Above the current price, the ETH/USD is just below the most powerful confluence by far in the range. It is a confluence that extends to $479 and is formed, in ascending order, by, among others, the 4H SMA200, the weekly 61.8% Fibonacci level, the daily S1 Pivot Point level, the minimum of the previous day, the daily 23.6% Fibonacci level, the 4-hour SMA100, the daily 38.2% Fibonacci level, the 1-hour SMA200, the daily 61.8%Fibonacci level, the weekly 38.2% Fibonacci retracement and, at the highest level in the large confluence zone, the daily R1 Pivot Point level and the daily SMA50 level. Not bad for resistance!!
Above the price level of $479, the confluence of the $487 price level is noteworthy. At this point, the weekly R1 Pivot Point level and the monthly 38.2% Fibonacci level coincide.
Below the current price, things are far from steady. There are hardly any confluences that can offer solid support, with the first one being at the $450price level where the weekly S1 and daily S3 converge, both of which are calculated from the Pivot Points indicator.
If it loses this support level, there is nothing below it until the price level of $425, where the weekly S2 Pivot Point level, the weekly 161.8% Fibonacci retracement level and June’s low converge.
Click to see the Full Confluence Indicator
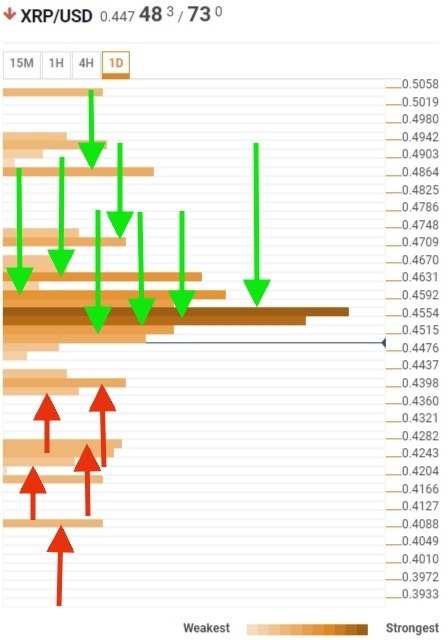
XRP 1D
Ripple is also in a borderline situation that keeps it very close to the cliff, but the enviable fact that XRP is holding on without falling off the cliff means that the indicators are converging and there is a chance to survive if it can get above the confluence just above it.
The XRP/USD is currently trading at $0.449 and has the strongest confluence of indicators in the segment just above it. This confluence starts at $0.4515and extends to over $0.4709. The list of components includes, among others, from bottom to top price levels on the daily S1 Pivot Point level, the weekly 61.8% Fibonacci level and yesterday’s lows, the 23.6% and 38.2% daily Fibonacci level, the 1-hour SMA200, the daily 61.8% and the weekly 38.2% Fibonacci levels, the daily R1 and R2 Pivot Points levels, the weekly 23.6% Fibonacci level and the 4-hour SMA200.
Below the current price, there are very few support levels that the XRP/USD can find. The first confluence that can give some support to the XRP/USD is around $0.439 and consists of the daily S3 and weekly S1 Pivot Point levels and last week’s lows.
If Ripple trips below this level, the next convergence is in the $0.42 price level, where June’s lows, the weekly S2 Pivot Point level and the weekly 161.8% Fibonacci retracement would be the last chance for the XRP/USD to avoid a catastrophe.
Click to see the Full Confluence Indicator
Original story: https://tinyurl.com/yd997utz