Here’s why one chart watcher is ready to buy the bitcoin dip
story by: Aaron Hankin
It may seem like catching a falling knife — but for those brave enough — now might be an opportune time up pick up some bitcoin on the cheap.
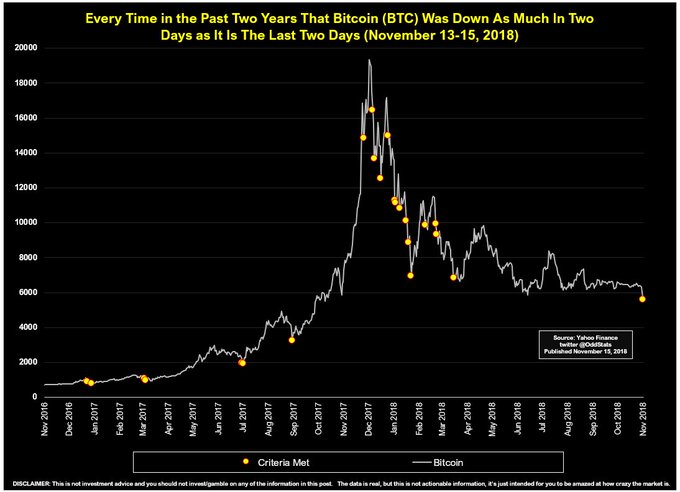
This chart comes from Twitter user @OddStats, who put together a chart of bitcoin and plotted significant two-day selloffs:
“Bitcoin $BTCUSD is down -11.9% in the past 2 days. Here’s a chart showing every time in the past two years where it has dropped at least that much in exactly 2 days. A lot of bottoms in there,” OddStats wrote.
Read: Bitcoin futures tumble 13%, trigger trading limit
The last time this occurred was March 29-30, when bitcoin BTCUSD, +0.61% tumbled 13.8% to close at $6,840. Crypto buyers were rewarded with a 46% rally in five weeks as the No. 1 digital currency surged toward $10,000, eventually stalling at $9,990 on May 5.
Original story by: https://www.marketwatch.com/story/heres-why-one-chart-watcher-is-ready-to-buy-the-bitcoin-dipin-one-chart-2018-11-16


