
Bitcoin Bubbles – This Isn’t Our First Rodeo
Story by: Hans Hauge
Summary
Previous downturns in the price of Bitcoin have been accompanied by reduced daily transactions and unique addresses in use.
The longest periods of stagnation in network statistics have been about six months since 2010.
In the past, we have seen two network responses to two different bubbles, temporary correlation and then divergence OR a lagging network recovery.
The 2017-2018 bubble seems to resemble more closely what happened in 2011.
If the network statistics from 2018 seem to mirror 2011, then transactions may lead the recovery while unique addresses lag.
Lessons from Bubble #1 and Bubble #2
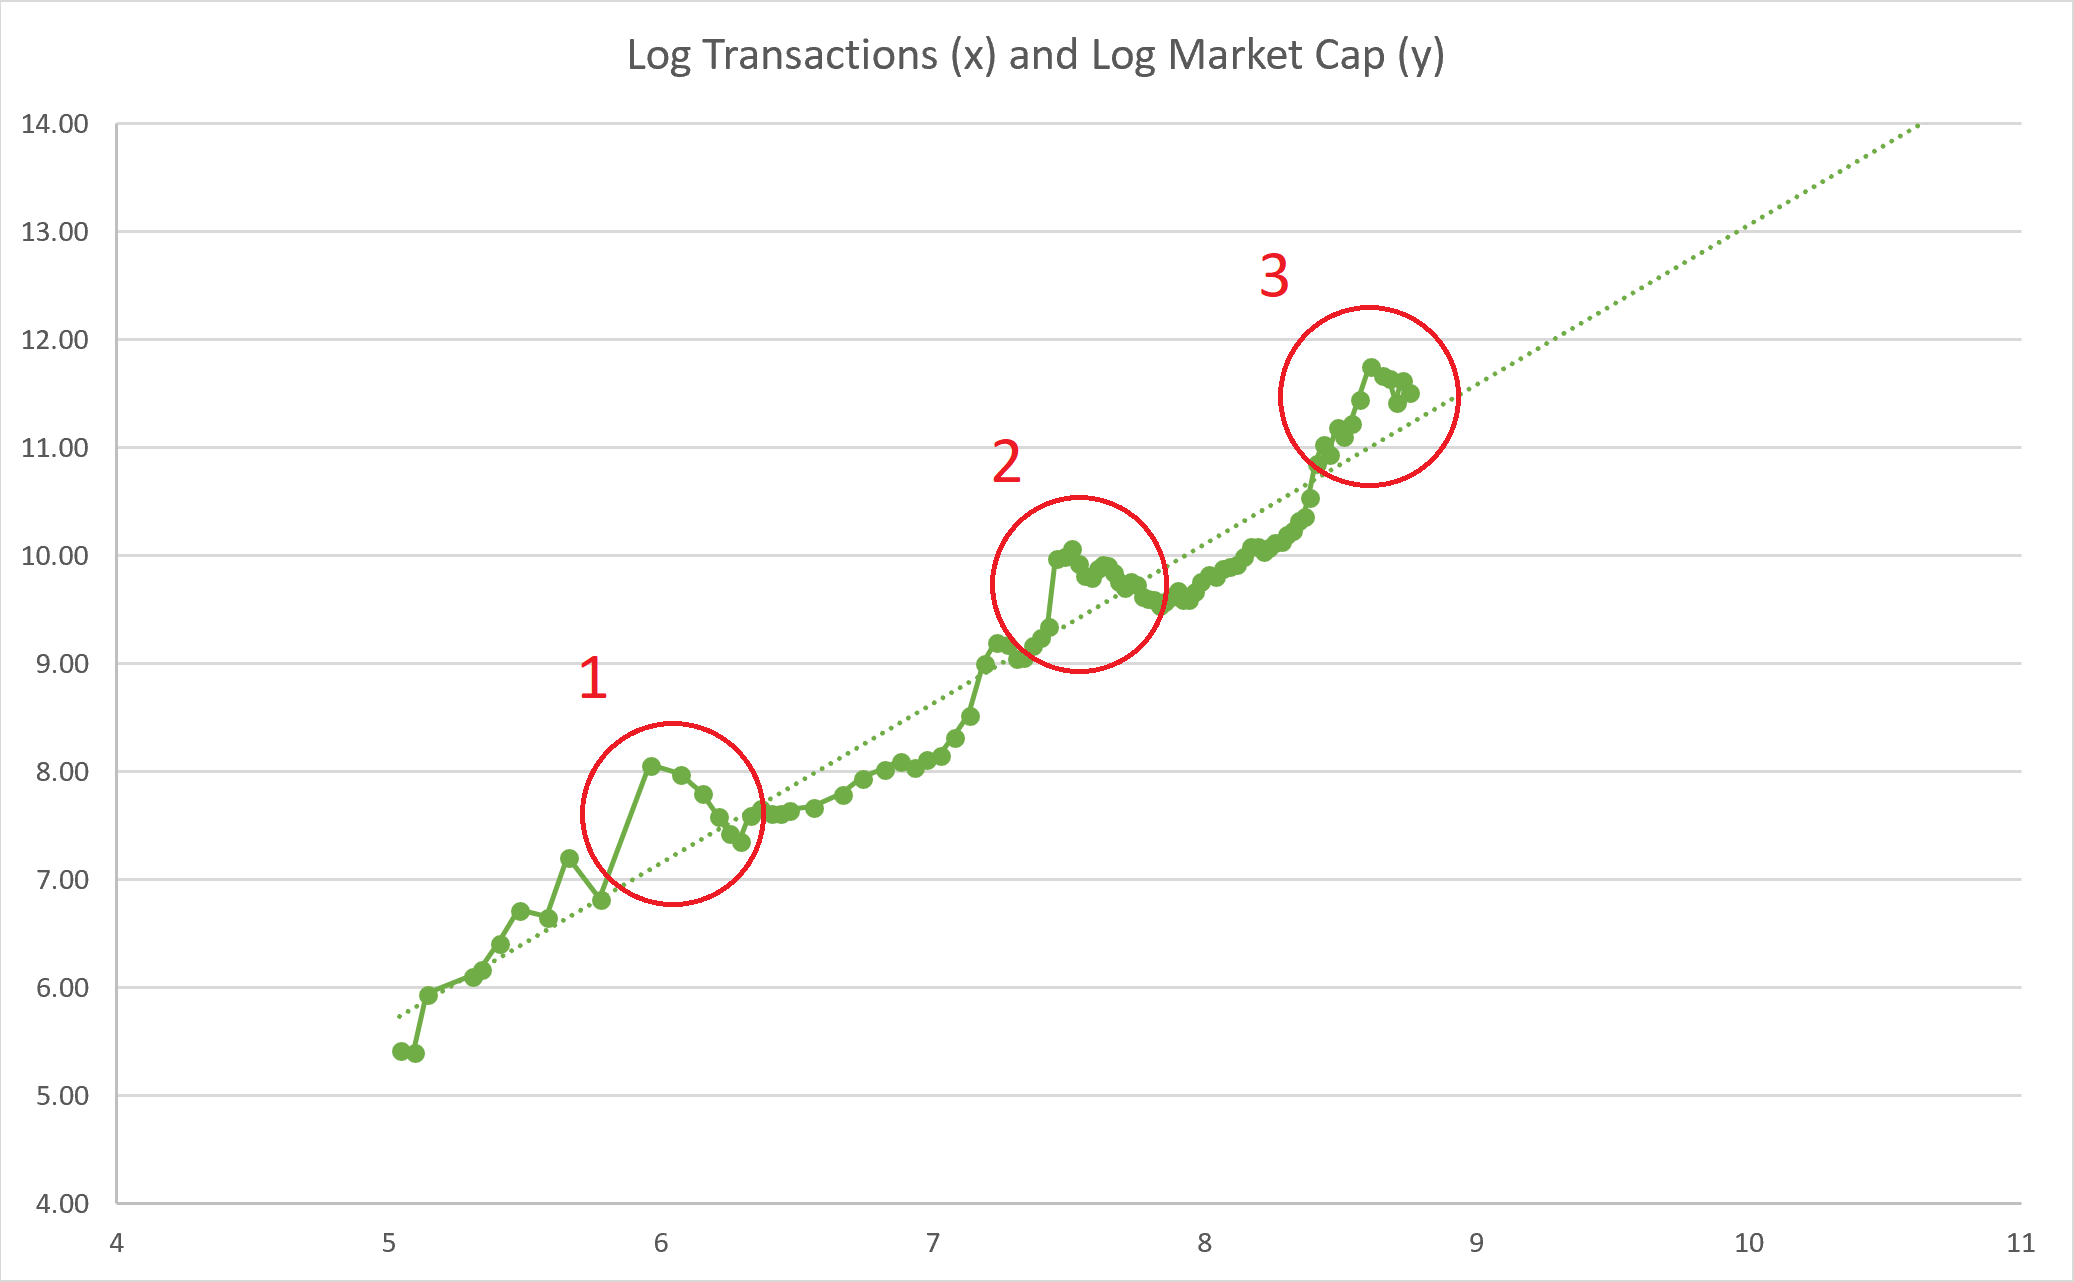
I believe that Bitcoin (BTC-USD) (COIN) (OTCQX:GBTC) has been through two primary bubbles in its eight-year price history. This is the third bubble that we’re going through right now, as I wrote about previously and the charts make abundantly clear. See below.
 Data Source: blockchain.com
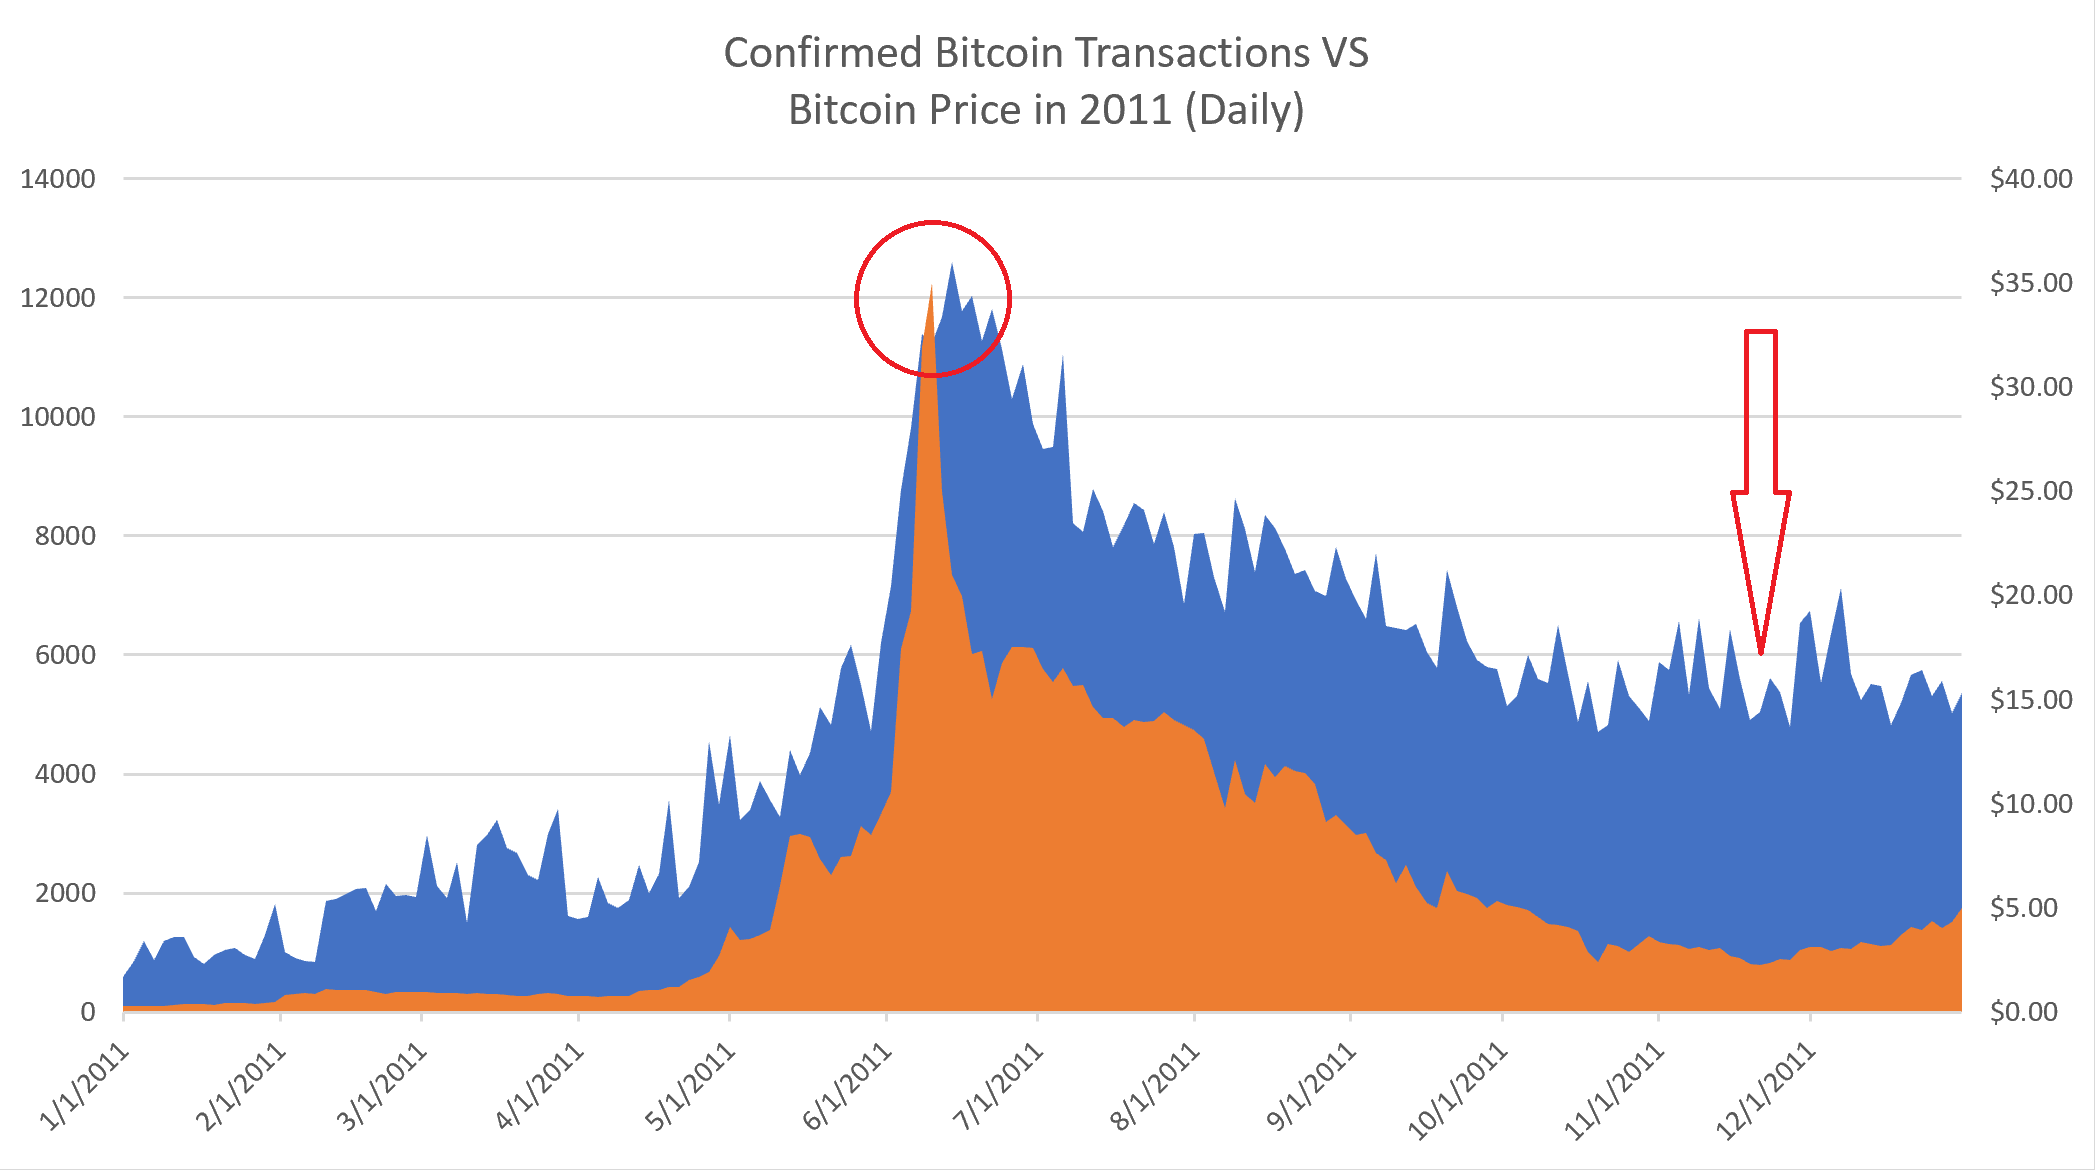
On June 10, 2011, the price of a single bitcoin was $35, an incredible high at the time. When that bubble popped (circle marked 1 above), the price fell to around $2.29 by November 21, 2011. This process would reduce Bitcoin’s price by 93.4% over the course of six months.
The Bitcoin bubble of 2011 – analyzing the Bitcoin network’s response
Confirmed transactions and Bitcoin price in 2011
During that time, it’s interesting to look at the relationship between the number of daily transactions and the price. Let’s look first at the daily breakdown.
 Data Source:
Original story: https://seekingalpha.com/article/4188683-bitcoin-bubbles-first-rodeo