
Bitcoin [BTC/USD] Technical Analysis: The bulls have come to stay this time
Story by:
The world’s first cryptocurrency, Bitcoin has been doing well for itself considering the previous year. The currency has picked itself up above the $4,000 line and has been holding it steadily. The market cap of Bitcoin is $71 billion with 24-hour trading volume at $5.08 billion.
1 Hour
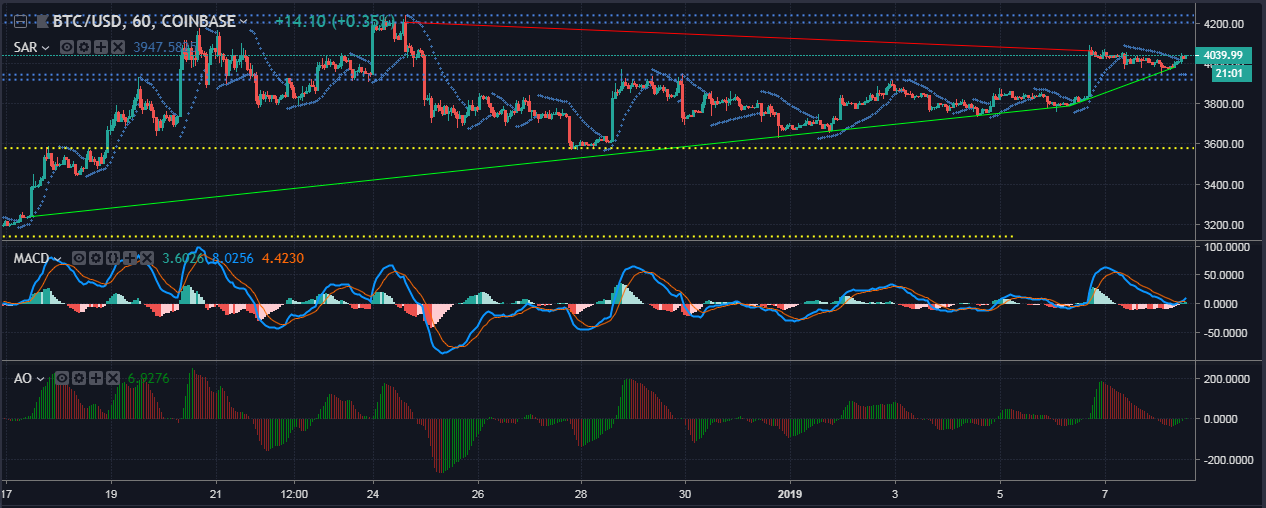
The one-hour chart of Bitcoin shows prices in an uptrend bullish movement which extends from $3,238 to $3,891. The downtrend, however, extends from $4,205 to $4,062. The prices are holding above the support at $3,578, while the resistance band range from $3919 to $3944 has been successfully breached and holding. The next resistance band range is from $4203 to $4239.
The Parabolic SAR markers are formed below the price candles which indicates a bullish trend for Bitcoin.
The MACD indicator is showing a bullish crossover as the MACD line has crossed above the signal line. The MACD histogram is also started sprouting green.
The Awesome Oscillator shows a bullish crossover that is still underway as the green bars have crossed over to the top of the zero-line.
1 Day
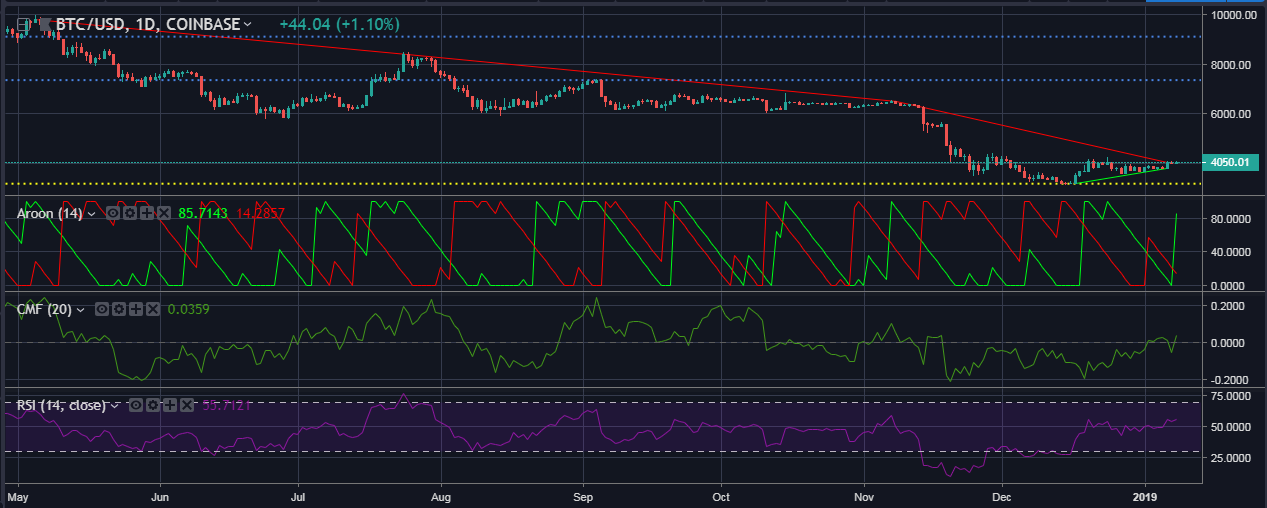
The uptrend for Bitcoin in the longer time-frame cannot be expected to be formed yet. The downtrend, however, can be seen hanging at $9800 to $4035. The prices are supported at $3183, with resistance lines present at $7359, $8385.
The Aroon indicator shows a sharp rise in uptrend i.e., the green Aroon-line to power as the downtrend seeps down to the zero mark.
The CMF is riding the wave above the zero-line which indicates that the money is flowing into the market for Bitcoin and buyers are controlling the market.
The Relative Strength Index shows a similar scenario where the buyers are controlling the Bitcoin markets as the RSI line is high and near the 55-line.
Conclusion
The one-hour chart for Bitcoin is showing a bullish scenario which is indicated confidently by SAR, MACD and the AO indicators. The one-day chart shows a similar bullish scenario as the one-hour chart which is indicated by the Aroon, CMF and the RSI indicators.
Original story by: https://ambcrypto.com/bitcoin-btc-usd-technical-analysis-the-bulls-have-come-to-stay-this-time/