
Bitcoin Stabilizes Above $40K Support Resistance Near$45K
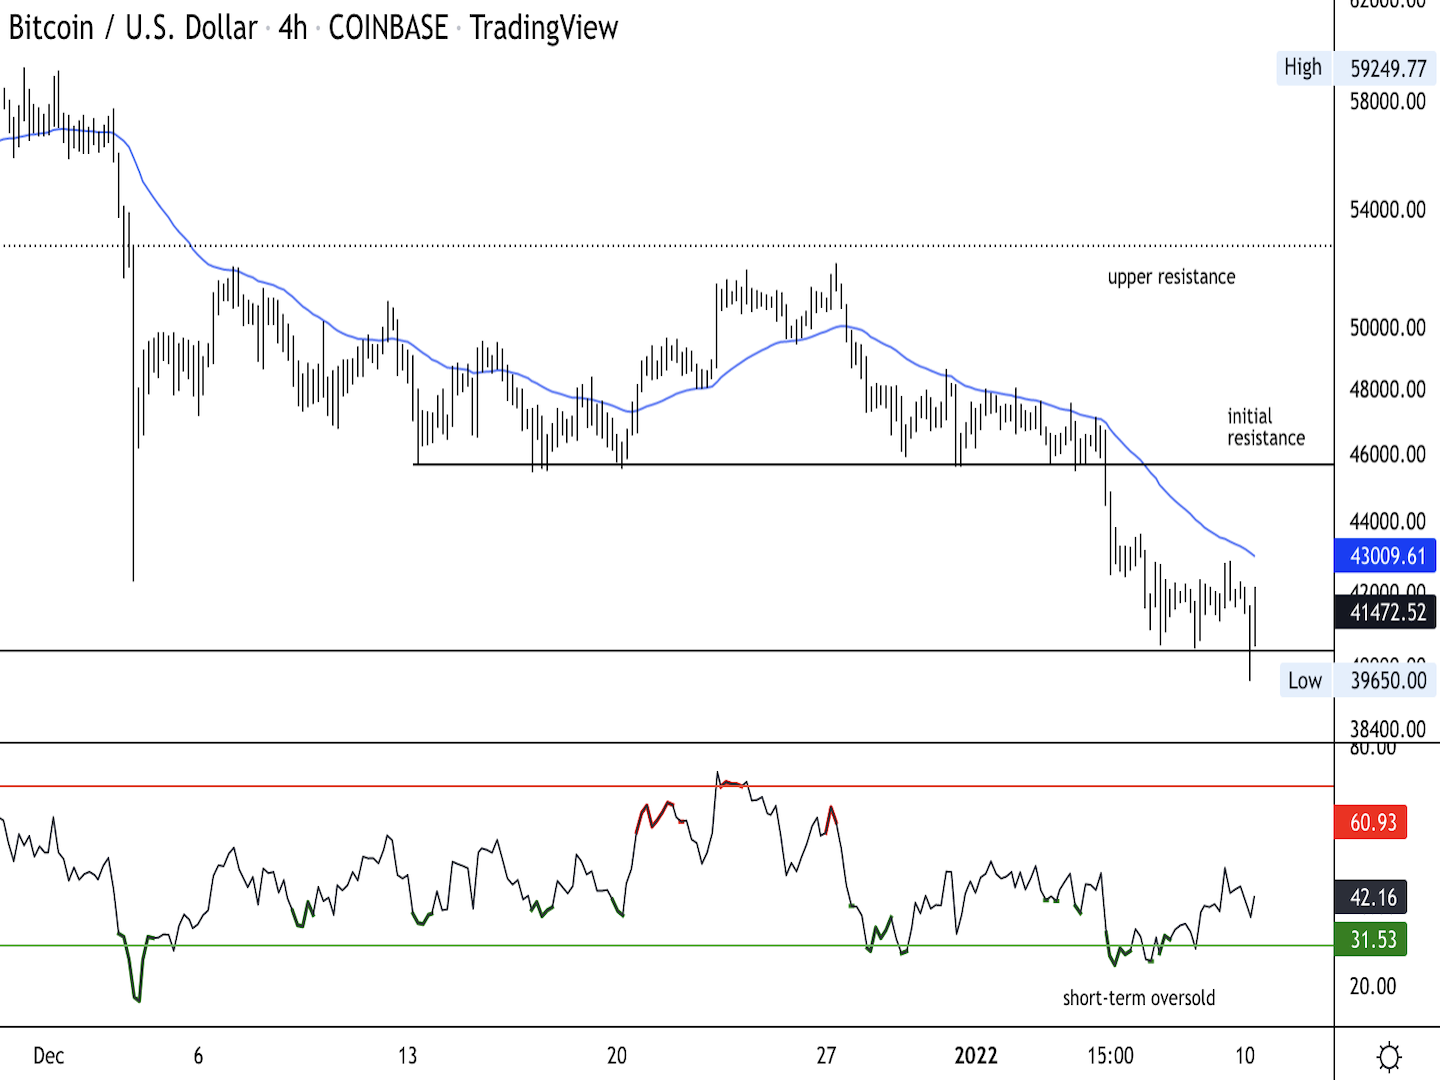
Bitcoin four-hour price chart shows support/resistance with RSI on bottom (Damanick Dantes/CoinDesk, TradingView)
BTC is down about 2% over the past 24 hours, although the price action has been fairly muted over the past few days.
The relative strength index (RSI) on the four-hour chart is rising from oversold levels, which typically precedes a brief price bounce. On the daily chart, the RSI is the most oversold since Dec. 10.
Upside momentum has weakened given BTC’s two-month long downtrend. This means sellers could remain active around resistance levels.
Via: Coindesk