
Top 3 Price Prediction Bitcoin, Ethereum, Ripple: Crypto market recovery in jeopardy
By John Isige
The cryptocurrency market is mixed red and green as the week grinds to a halt. Bitcoin and Ethereum are among the few assets that have accrued minor gains over the last 24 hours. ABBC Coin incurred a substantial loss in the same period, amounting to 15%. Altcoins, particularly the decentralized finance (DeFi) tokens, continue with sluggish price action, ignoring Bitcoin’s recent surge.
A minor change can be observed in the total capitalization for the crypto market. From $409 billion posted on Wednesday, the market cap has declined to $406 billion at the time of writing. The dip is reminiscent of the drab trading across the board and Bitcoin’s slump to $13,000.
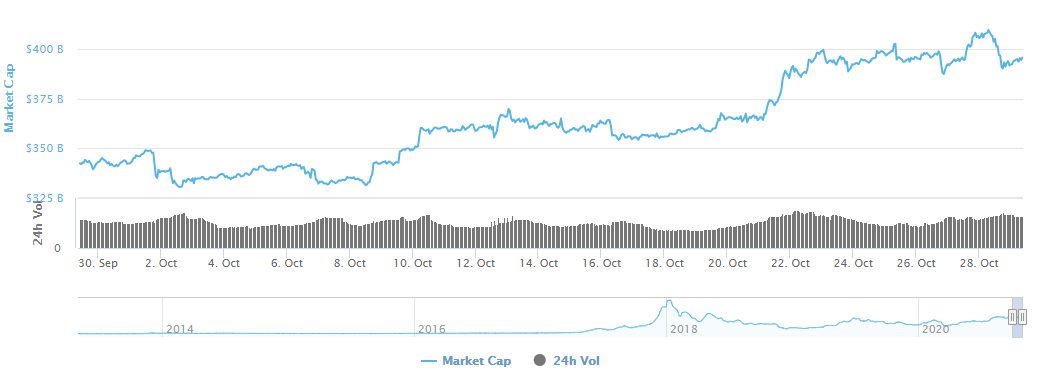
Crypto market cap chart
Bitcoin struggles with sustaining the uptrend
As reported, the flagship cryptocurrency recently hit new yearly highs after spiking past $13,000 and closing in on the June 2019’s high. However, the remarkable momentum lost steam, leaving a gap that has been extensively explored by the bears.
Bitcoin embarked on a retreat as discussed but embraced support at $13,000 aided by the 50 Simple Moving Average. Meanwhile, BTC/USD is exchanging hands at $13,266 amid a struggle to nurture the uptrend.
The Relative Strength Index (RSI) sharp dive from overbought territory places BTC slightly in bears’ hands. However, the immediate correction above the midline suggests that buyers are not ready to give up.
 (55)-637395539791443425.png)
BTC/USD 4-hour chart
On the other hand, it is essential to realize that selling pressure will intensify if the price action fails to pick momentum towards $13,500. The bellwether cryptocurrency may then retest the 50 SMA support. If push comes to shove, and a dip under $13,000 occurs, losses targeting the 100 SMA will likely come into the picture.
Ethereum recovery faces challenges
The smart contract token caved into the bearish pressure below the critical $400 level. The lower leg extended to the crucial support at $380 before a shallow recovery came into the picture. In the meantime, the crypto has stepped above the 100 SMA in the 4-hour timeframe to trade at $391.
Ethereum is also sitting on the x-axis of the ascending triangle established in the early October days. The RSI shows the bulls’ return, but the stalling under the midline reveals lack of buying pressure to push ETH/USD beyond $400. If Ethereum closes the day above the 50 SMA, recovery to $420 will begin.
 - 2020-10-29T095456.516-637395540237609224.png)
ETH/USD 4-hour chart
It is worth mentioning that a reversal below the x-axis and closing beneath the 100 SMA will call for more sell orders. Thus, Ether could revisit support at $380 and the 200 SMA (marginally above $370).
Ripple bulls losing the tug of war
Ripple refreshed support at $0.246, as predicted on Wednesday. The down leg came after the cross-border token hit a wall slightly above $0.26. Moreover, XRP did not have the energy to build upon the x-axis of the ascending triangle.
For now, the crypto asset is teetering at $0.2462 while dealing with the immediate resistance at the 200 SMA in the 4-hour range. If bearish momentum keeps building, a slip under the hypotenuse might resume the downtrend. Glancing lower, $0.24 is the nearest target while $0.23 and $0.22 are in line to cushion XRP from falling massively below $0.2.
-637395540713419396.png)
XRP/USD 4-hour chart
It is essential to keep in mind that the bearish outlook will be invalidated if the price closes the day above the 200 SMA. The bullish leg is likely to extend to the 100 SMA, currently at $0.25. Action towards $0.26 must bring down the hurdles at the 50 SMA and $0.255 level
Via: FXStreet