
Long-Term Outlook For Bitcoin: August 25, 2018
Story by: The Freedonia Cooperative
Summary
BTC weekly charts have been influenced by news items like ETF decisions by the SEC.
Bitcoin has been range-trading for the past three months giving us insight into support levels to use for trading.
Charts call for bullish near short-term trading.
Members of our private investing community, The Coin Agora, get exclusive access to ideas like this one. Get started today >>
Long Term Outlook for (BTC-USD): August 25, 2018
The price of BTC/USD has been trading in a well-defined range on the weekly chart. The price of the number one cryptocurrency has largely been dictated by the various attempts at approving a Bitcoin ETF in the United States. So what is the outlook for BTC/USD at the present time?
Fundamental Outlook
On Wednesday August 22, the US Securities and Exchange Commission rejected 9 Bitcoin Exchange Traded Funds (ETF) applications, citing concerns over possible loopholes for fraud and price manipulations. Bitcoin and other major cryptos lost some ground as a result of this announcement. But in an about face on Friday August 24, the SEC’s Commissioners announced that they would review this decision.
This news, as well as expert opinion showing the road to an ETF, has sparked renewed buying interest in Bitcoin, albeit within the context of the technical ranges which will be explained below. The decisions on ETF approvals by the SEC are seen as key fundamental influences on Bitcoin prices, as a regulated Bitcoin ETF will attract the institutional investment that has been lacking in this market since inception. Moreso, many point to Bakkt, the new program from the NYSE as a step in the right direction as well.
Technical Outlook
The BTC/USD chart shown below displays a very clear picture of BTC/USD trading within a specific tight range.
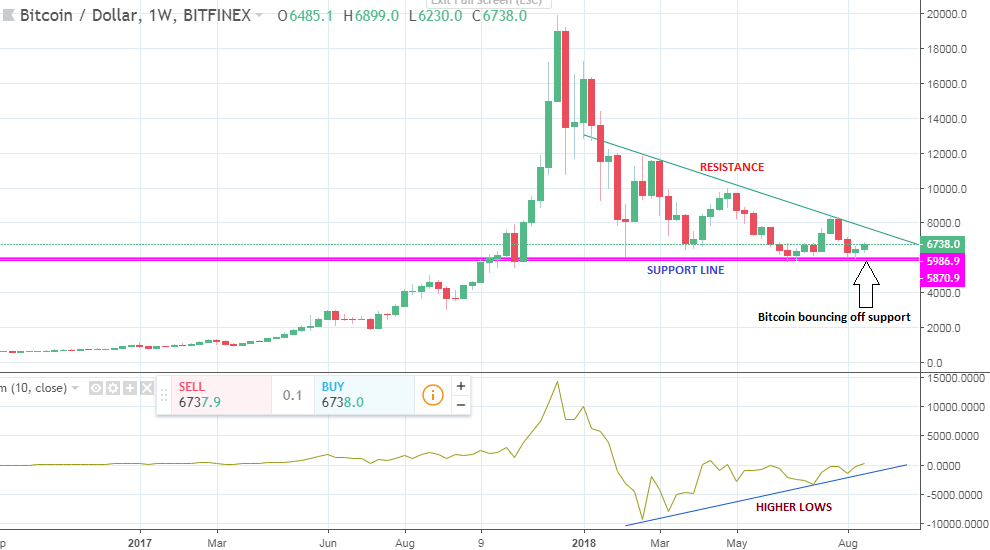
BTC/USD Weekly Chart: August 25, 2018
- To the upside, we see a descending trend line which has served to place a cap on the price action since February 2018. This is the resistance line.
- To the downside, the support at $5,700 has held firm, and has served as an area from which prices have rallied all through the months of March to August 2018.
- The momentum indicator has formed three price troughs, with each one forming at a higher level than the previous one. This marks higher lows for the oscillator and could be pointing to a divergence situation.
- Price action is presently heading upwards after bouncing on the support line, on the back of the announcement of the Bitcoin ETF decision review.