
BITCOIN PRICE ANALYSIS: BEHOLD THE POWER OF THE FIBONACCI EXTENSION TOOL
Story by: OLLIE LEECH
THE WONDER OF FIBONACCI NUMBERS
The Fibonacci sequence is a string of special numbers ‘discovered’ by an Italian mathematician named Leonardo Fibonacci, during the late 12th century. What is so interesting about these particular numbers, is that the sequence of numbers makes up the ‘Golden Ratio’ or ‘Golden Spiral’, which is around the number 1.618.
This golden spiral can be seen in the way that flowers produce petals, snails grow their shells and even how stars appear in our galaxy. But in this case, we’ll look at this unique sequence of numbers apply to the trading charts.
So we know that the Golden Ratio number is 1.618, but there are also other Fibonacci numbers that are used in the Fibonacci extension tool; namely the 0.618, 0.786, 1.0, 1.382 levels.
In order to predict future price targets or reversal points in an uptrend, we must first identify 3 areas; (1) A swing low (2) a new swing high, and (3) a new swing low.
Conversely, if you wish to predict future points in a downtrend, you would look for the opposite swing levels (swing highs instead of swing lows, etc). In order to get the best results, you want to look out for strong impulse movements with clear pullbacks.
BITCOIN PRICE ANALYSIS: RECENT EXAMPLE
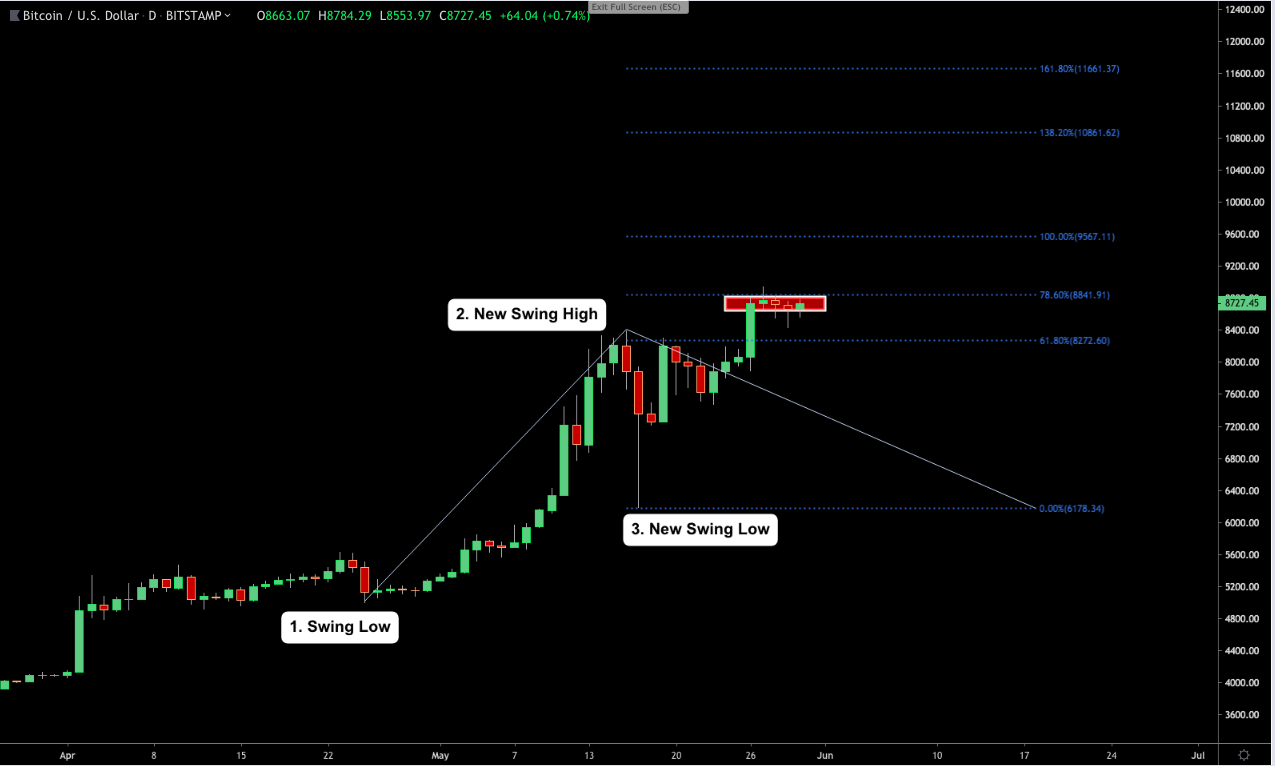
On the daily BTC/USD chart we can see the recent price activity of Bitcoin over the last 4 weeks
To use the Fibonacci extension tool (Fib Extn) we must first identify a swing low, which in this case is the $4,991 level from April 25. Next, we connect the swing low to the new swing high – which in this case was the new YTD-high of $8,390 on May 16. Finally, we connect the new swing high to the new swing low value, which sits at the $6,178 level.
How the Fib Extn tool works, is it works out the Fibonacci numbers between the old swing low and the new swing high and projects them from the new swing low point.
By doing so we can see that Bitcoin (BTC) has already begun consolidating around the 0.786 level at $8,841. If the uptrend continues, it is likely that we’ll see further interaction at the other extension numbers above, namely the 1.382 and 1.618 levels. Alternatively, if BTC starts to correct then we should look at the 0.618 level as possible support where bullish traders might launch an upside recovery from.
BTC/USD PAST EXAMPLE
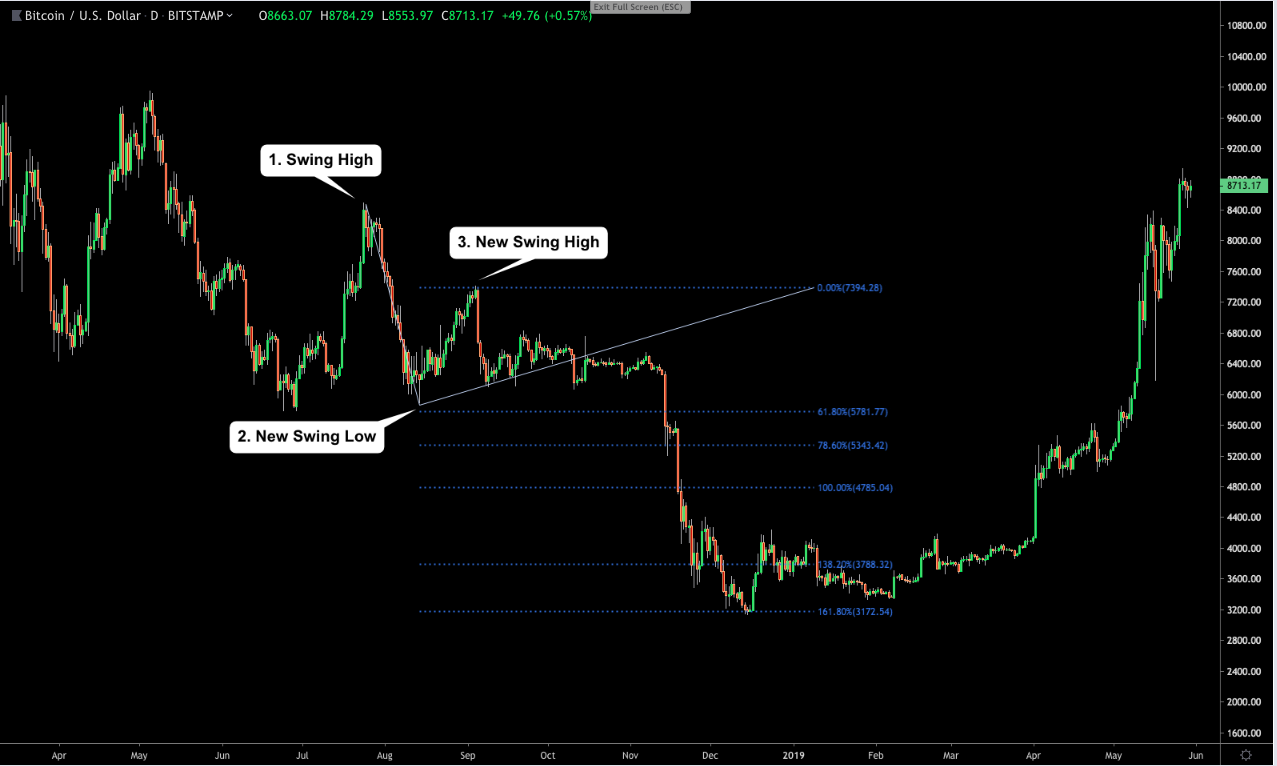
So we’ve seen how the Fib Extn tool works in an uptrend, now let’s take a look at how well it works during a downtrend.
In the example here, we can see that by connecting the major swing points that took place between July and September last year prior to the November bear market, the resulting 1.618 extension perfectly predicted the bottom of the Bitcoin market. (BOOM!)
We can also see that the 0.786 Fibonacci level at $5,343 accurately predicted the bottom of the opening sell-off which sent Bitcoin packing 15% on November 14, and the 1.382 level lined up perfectly with the strong support that held up Bitcoin’s price temporarily on November 18.
It should be noted that while these levels work well in many cases, the Fibonacci extension tool should not be used in isolation. Other signallers such as momentum oscillators, volume profile indicators, and money flow indexes should also supplement your analyses.
Original story: https://bitcoinist.com/bitcoin-price-analysis-fibonacci-extension-tool/